Events on the Horizon
With the first quarter of 2021 winding down in two weeks time, we parsed through our data to look for any trends in corporate actions versus Q4 2020 and the year ago quarter. A few things stood out, and have different implications for investors.
M&A and Spinoffs
Slowly but surely the pace of M&A and spinoff activity is picking up. Evidence of a turnaround emerged in Q4 2020, and with 2 weeks still left in the first quarter we are seeing a continuation of that trend.
The M&A count for Q1 2021 currently stands at 126. This is compared to just 78 in the year-ago quarter (growth of 61% YoY), and 148 last quarter (Figure 1). Note that this is a global number, and many of the international developed markets were hit with COVID before the US, making for an easy year-over-year comparison. Keep in mind this is still very low on a historical basis, the average for quarterly M&A activity in 2018 and 2019 was 918.
Spinoffs on the other hand are at their highest level since Q3 2019. There have been 13 spinoffs recorded for the first quarter vs. 5 in the year-ago quarter and 7 in Q4 2020, growth of 160% and 86%, respectively (Figure 1). This is also on par with the 2018/2019 quarterly average of 13.75 spinoffs. One explanation for the increased activity could be that the market has been rewarding shares of spinoffs, with the S&P Spin-Off ETF (CSD) outpacing the S&P 500 ETF and the MSCI All Country World Index ETF (ACWI) since the start of Q2 2020.
Figure 1: Wall Street Horizon’s Data of Announced M&A deals and Corporate Spinoffs by Quarter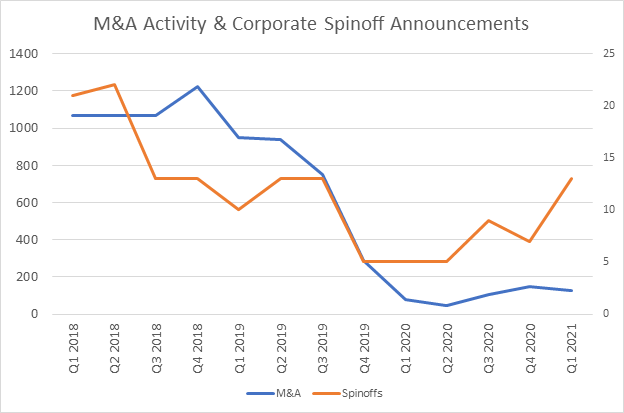
Prior to the pandemic, US corporations had record levels of cash on hand, and immense monetary policy and fiscal support during COVID has only exacerbated that for many businesses. Companies are now putting that cash to work and seeking out opportunities in the marketplace. Another area showing companies are spending? Buybacks. While still off from record levels in 2018 and 2019 (quarterly average of 409), those too are seeing a comeback in Q4 2020 and Q1 2021 (Figure 2).
Figure 2: Wall Street Horizon’s Data of Announced Buybacks by Quarter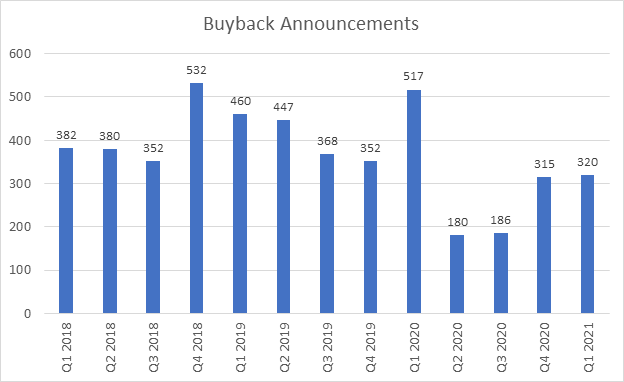
Secondary offerings remain high
Perhaps counter to this is the fact that secondary offerings also remain high, further deepening this “have and have not” narrative created by the pandemic. These are the companies that need cash.
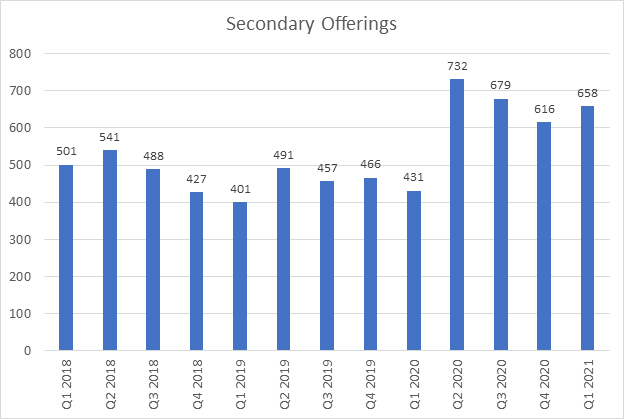
So far in Q1 2021 we are seeing 658 secondary offerings, the third largest number in the last 3 years and we still have 2 weeks left in the quarter. The only two quarters with higher secondary offerings since 2018 were Q2 2020 (732) and Q3 2020 (679). After a brief dip to 616 in Q4 2020, that number was expected to continue to fall (Figure 3)
Secondary offerings are both positive and negative for shareholders. Positive in that having the additional cash makes it possible for hard hit companies to survive the crisis, negative in that their shares will now be diluted. Not to mention the work these corporations will have to do to fix up their balance sheets due to the massive amounts of debt they’ve had to take on in the last year.
Some of the biggest companies announcing secondary offerings in the last year were the airlines, as they try to stay afloat and ride this thing out. Every major carrier announced at least one secondary offering (many 2 or even 3!), but not all carried through. Southwest closed two rounds of secondary offerings in April and August, of 55M and 9M shares, respectively. The latest announcement on February 8, 2021 has not yet been closed. Those closing two rounds include American Airlines and Spirit, with United announcing a second secondary offering in November that has not closed. Meanwhile JetBlue completed one offering in December, while Delta’s announced secondary offering of 74M shares in May never closed. Airlines are trying to raise as much cash as possible as they don’t know when travel will return or passengers will feel comfortable. That day may be coming sooner rather than later as vaccine rollouts continue and pent up consumer demand is about to burst. Just this weekend air travel hit its highest levels in over a year, with the TSA screening over 1 million people each day since Thursday.
Figure 3: Wall Street Horizon’s Data of Announced Secondary Offerings by Quarter
Recent Content
-
_thumb.png)
Volatility Watch: Eyeing a Pair of Blue Chips with Unusual Earnings Dates in the Heart of the Reporting Season
-
_thumb.png)
The Magnificent 7 Get Set to Report Amidst an S&P 500 Losing Streak
-
_thumb.png)
CEO Uncertainty Spikes After Improving Last Quarter
-
_thumb.png)
Earnings Season Heats Up, Spotting Two Unusual Reporting Dates in the Consumer Space
-
CNBC: Brace Yourself for Short-Term Volatility
-

Cheddar: It's Not Just You: The ‘Vibes Are a Little Off’ in This Economy
-
Data Minds - Triple Threat: Leveraging Data to Manage AI, ESG, and ETF Risks | April 11, 2024 [Recording Available]
-

Seeking Alpha: Q1 2024 Earnings Preview: Will Reports Be Good Enough To Turn Markets Positive
-

BNN Bloomberg: Markets today: 'Mag Seven' power stocks in run-up to U.S. earnings
-
_thumb.png)
Q1 2024 Earnings Preview: Will Reports be Good Enough to Turn Markets Positive?